


À la LaTeX
LATEST POST
Topics: quick reference and extensions to write in LaTeX.
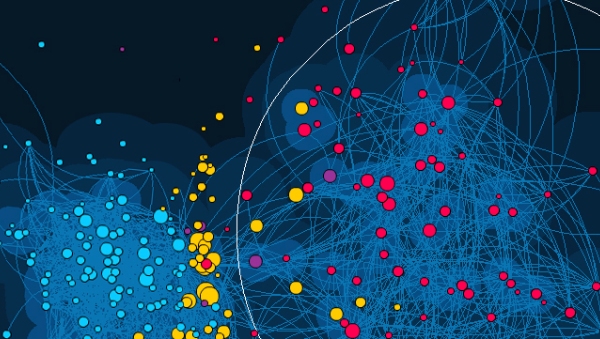
Web-based Interactive Maps
Topics: responsive. True interactivity: zoom in, zoom out, markers, pop-ups, move around, etc.


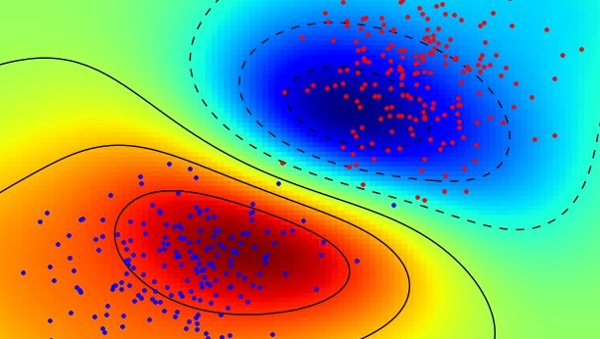
Machine Learning; Classifiers & Clusters
Topics: classification and clustering methods. Unsupervised techniques. Clustering: k-means, k-nearest neighbours, hierarchical clustering. Supervised techniques: regression, tree, random forests. Training, testing, predicting. Performance measures: Dunn’s index, ROC, AUC, confusion matrix.
Survival of the Fittest
Topics: survival analysis. Event history analysis. Failure and churn analysis. Parametric, semiparametric, and nonparametric models: proportional hazards, accelerated failure time, exponential, piecewise exponential, Weibull, lognormal and Cox regression. Customer churn analysis. Censored and truncated data. Limited dependent variable and Tobit models.
Algorithms and Spam
Topics: analyze texts (emails) with algorithms. Differentiate spam and nonspam. Custom methods, tree-based methods, and Support Vector Machine. Train, test, and evaluate the methods.

Sieving Data
Topics: data mining. Market basket analysis. Understanding consumer behaviour. Association rules or what is behind recommendation systems. data mining. Market basket analysis. Understanding consumer behaviour. Association rules or what is behind recommendation systems. Dimension reduction. Multidimensional scaling. Factorial analysis, Component analysis (principal, simple, multiple). Linear discriminant analysis. Feature selection.
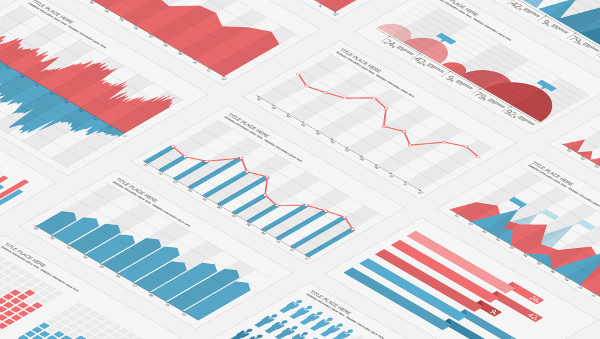
Infographic software
Topics: experimenting with Tableau. Infographic examples.
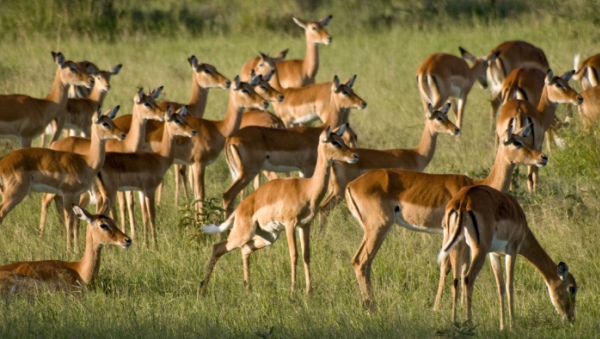
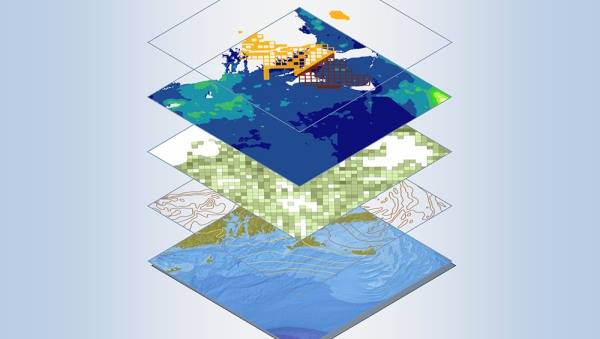
Geospatial Analysis and Geostatistics
Topics: introduction to geospatial models. Visualization with maps. Analyze the Australian Football League audience. Spatial autocorrelation. Autoregressive, lag and error models. Spatial logit and probit models. More advanced models.
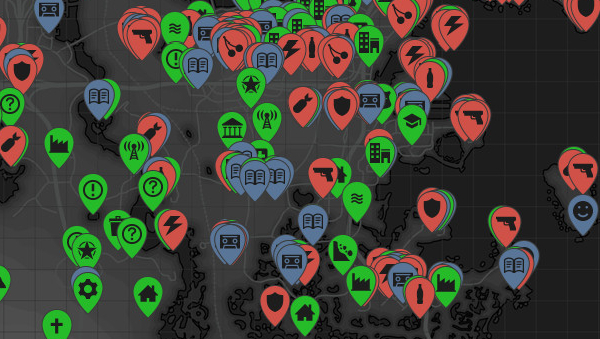
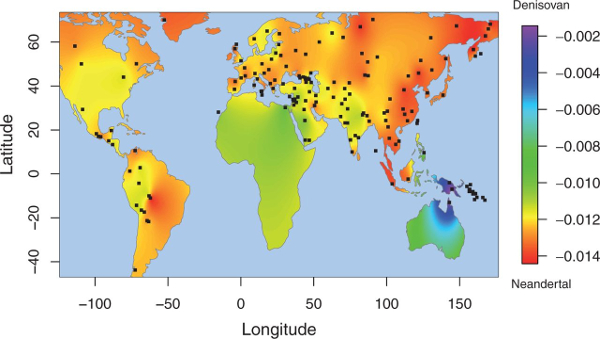
Map Mashup & Geointelligence
Topics: data visualization and map mashups. Introduction to spatial analysis. How to add intelligence to maps.

Tweet, Tweet
Topics: web scraping (tweets) with an API. Natural Language Processing. Select topics and keywords to capture tweets. Get up-to-the-minute data and measure delays between tweet (tweeting speed). Text mining and word clouds. Compare two topics: assess popularity with the Poisson distribution. Analyze and manipulate text strings.

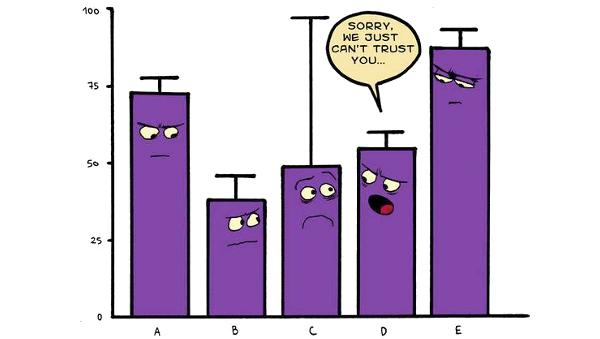
Descriptive & Inferential Statistics
Topics: basic to advanced statistical methods. Analyze census data (US state population). Infer the population with sampling and bootstrapping. Simulations and Monte Carlos.

Optimizing the Coffee
Topics: mathematical optimization. The cooling effect of cream in the coffee. Extrapolation and interpolation.


Pythonic Stuff
Topics: a series of projects. A website using a simple web framework. Documentation websites using static site generators. A command-line game and an application to be downloaded and installed.
Interactive Visualization
Topics: interactive data visualization and graphics.
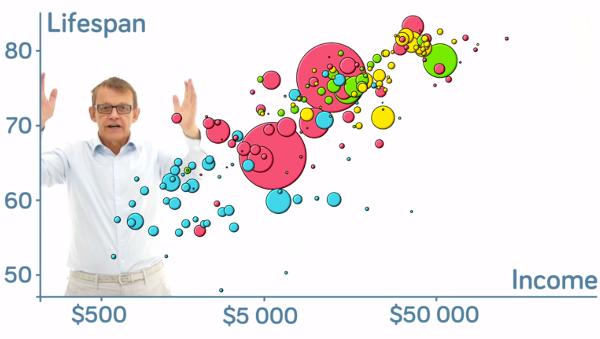
Visualization
Topics: show graphics and maps instead of explanation or simple data tables. Static visualization. Bring opaque data into general understanding. Storytelling with numbers. Present surveys and polling data.

...and counting
Topics: Model consumer demand (unit sold). Predict trends. Poisson and Negative Binomial distributions for counting discrete events.

Data Storytelling
Topics: present to a technical and a nontechnical audience. Storytelling. Bring arcane subjects into general use. Use econometrics techniques. Pose hypotheses, set goals, perform analyses and draw conclusions.
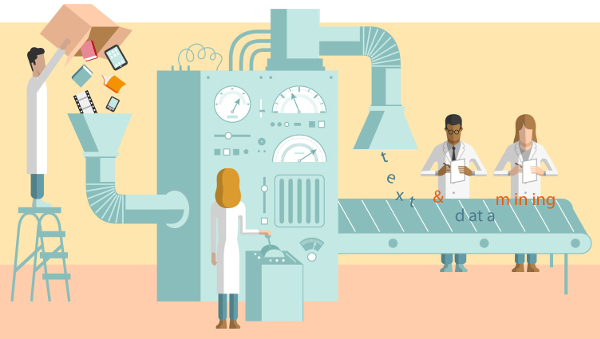
Forage de texte
Sujets: Sujets: traitement du langage naturel. Construire un corpus de textes. Explorer les statistiques. Visualiser les mots, les fréquences, les mots communs, les mots différents, les bigrammes. Utiliser des nuages, des graphiques à barres et des dendrogrammes.

Mining Text
Topics: natural language processing, sentiment analysis, and topic modeling. Build a corpus of texts (documents or any tweet, email, comment, publication, status, etc.). Download data using APIs. Populate a database. Explore the statistics. Filter and extract regular expressions. Visualize words, frequencies, ngrams. Assess sentiment, draw conclusions, and provide advice.

Exploring Pitch Data
Topics: multivariate analysis and visual exploration. Clean and format datasets. Pitching velocity, mix, patterns, location in the ball-strike zone. Change by month, by game, by inning. Ball-strike count, early- and late-game situations. Velocity, impact, and contact rate.

Titanic: Getting the Picture
Topics: decision trees, k-NN, and random forests. Storytelling and narrative. Data exploration: tables vs Venn diagrams vs visualization. Train and test sets. Confusion Matrix. Folds and cross validation. Pruning and avoiding overfitting.

Modeling Credit Risk
Topics: logit, probit, loglog and decision trees. Descriptive statistics. Train and test sets. Predictions. Confusion Matrix and ROC. Bank loan portfolio acceptance rate, bad rate, and risk tolerance.