Interactive Visualization
Topics: interactive data visualization and graphics.
Code: R, Python / Tool: RStudio, Jupyter
Static graphics and maps are images we can add to documents, web sites, and web-based documents. Interactive visualizations can be embedded into web pages and web-based documents. Like audio and video assets, they provide a richer and responsive content (pop-ups, for example).
R interactive visualization
The ggvis and ggplot2 packages (and some of its extensions) can produce interactive outputs. Plotly is a multilanguage package that can produce interactive outputs (R plotly below). There are other packages with limited capababilities such as the GoogleVis package (further down). We can also mention dygraphs, rbokeh, highcharter among others (not to mention R widgets).
The plotly package
Consult the series of mini-cases in a new tab (Show/Hide All Code in the case upper-right corner).
 |
 |
|---|---|
 |
 |
The googleVis package
Consult the mini-case in a new tab (Show/Hide All Code in the case upper-right corner).
 |
|---|
 |
Python interactive visualizations
Apart from plotly, the ecosystem is rich. The Python packages are based on two main syntaxes.
- The JavaScript-based syntax: Python Bokeh,
mpld3, Holoviews,bqplot,toyploy, and many more. - The JSON-based syntax:
pygal,d3po, the Vincent/Vega/Vega-Lite suite, Altair, and many more. - There are other syntaxes: Lighting in one example.
Here are two examples with pygal and its SVG outputs (that can be integrated into HTML or be generated dynamically using a Python framework such as Flask or Django).
GIF
SVG (interactive)
GIF
SVG (interactive)
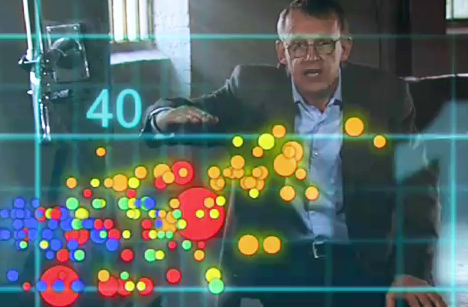
A special thank to Hans Rosling (1948-2017), a pioneer in interactive data visualization. Among other things, he was a statistician and public speaker who co-founded the Gapminder Foundation. He used data compiled by the UN and the World Bank to explain healthcare statistics with animated graphics.