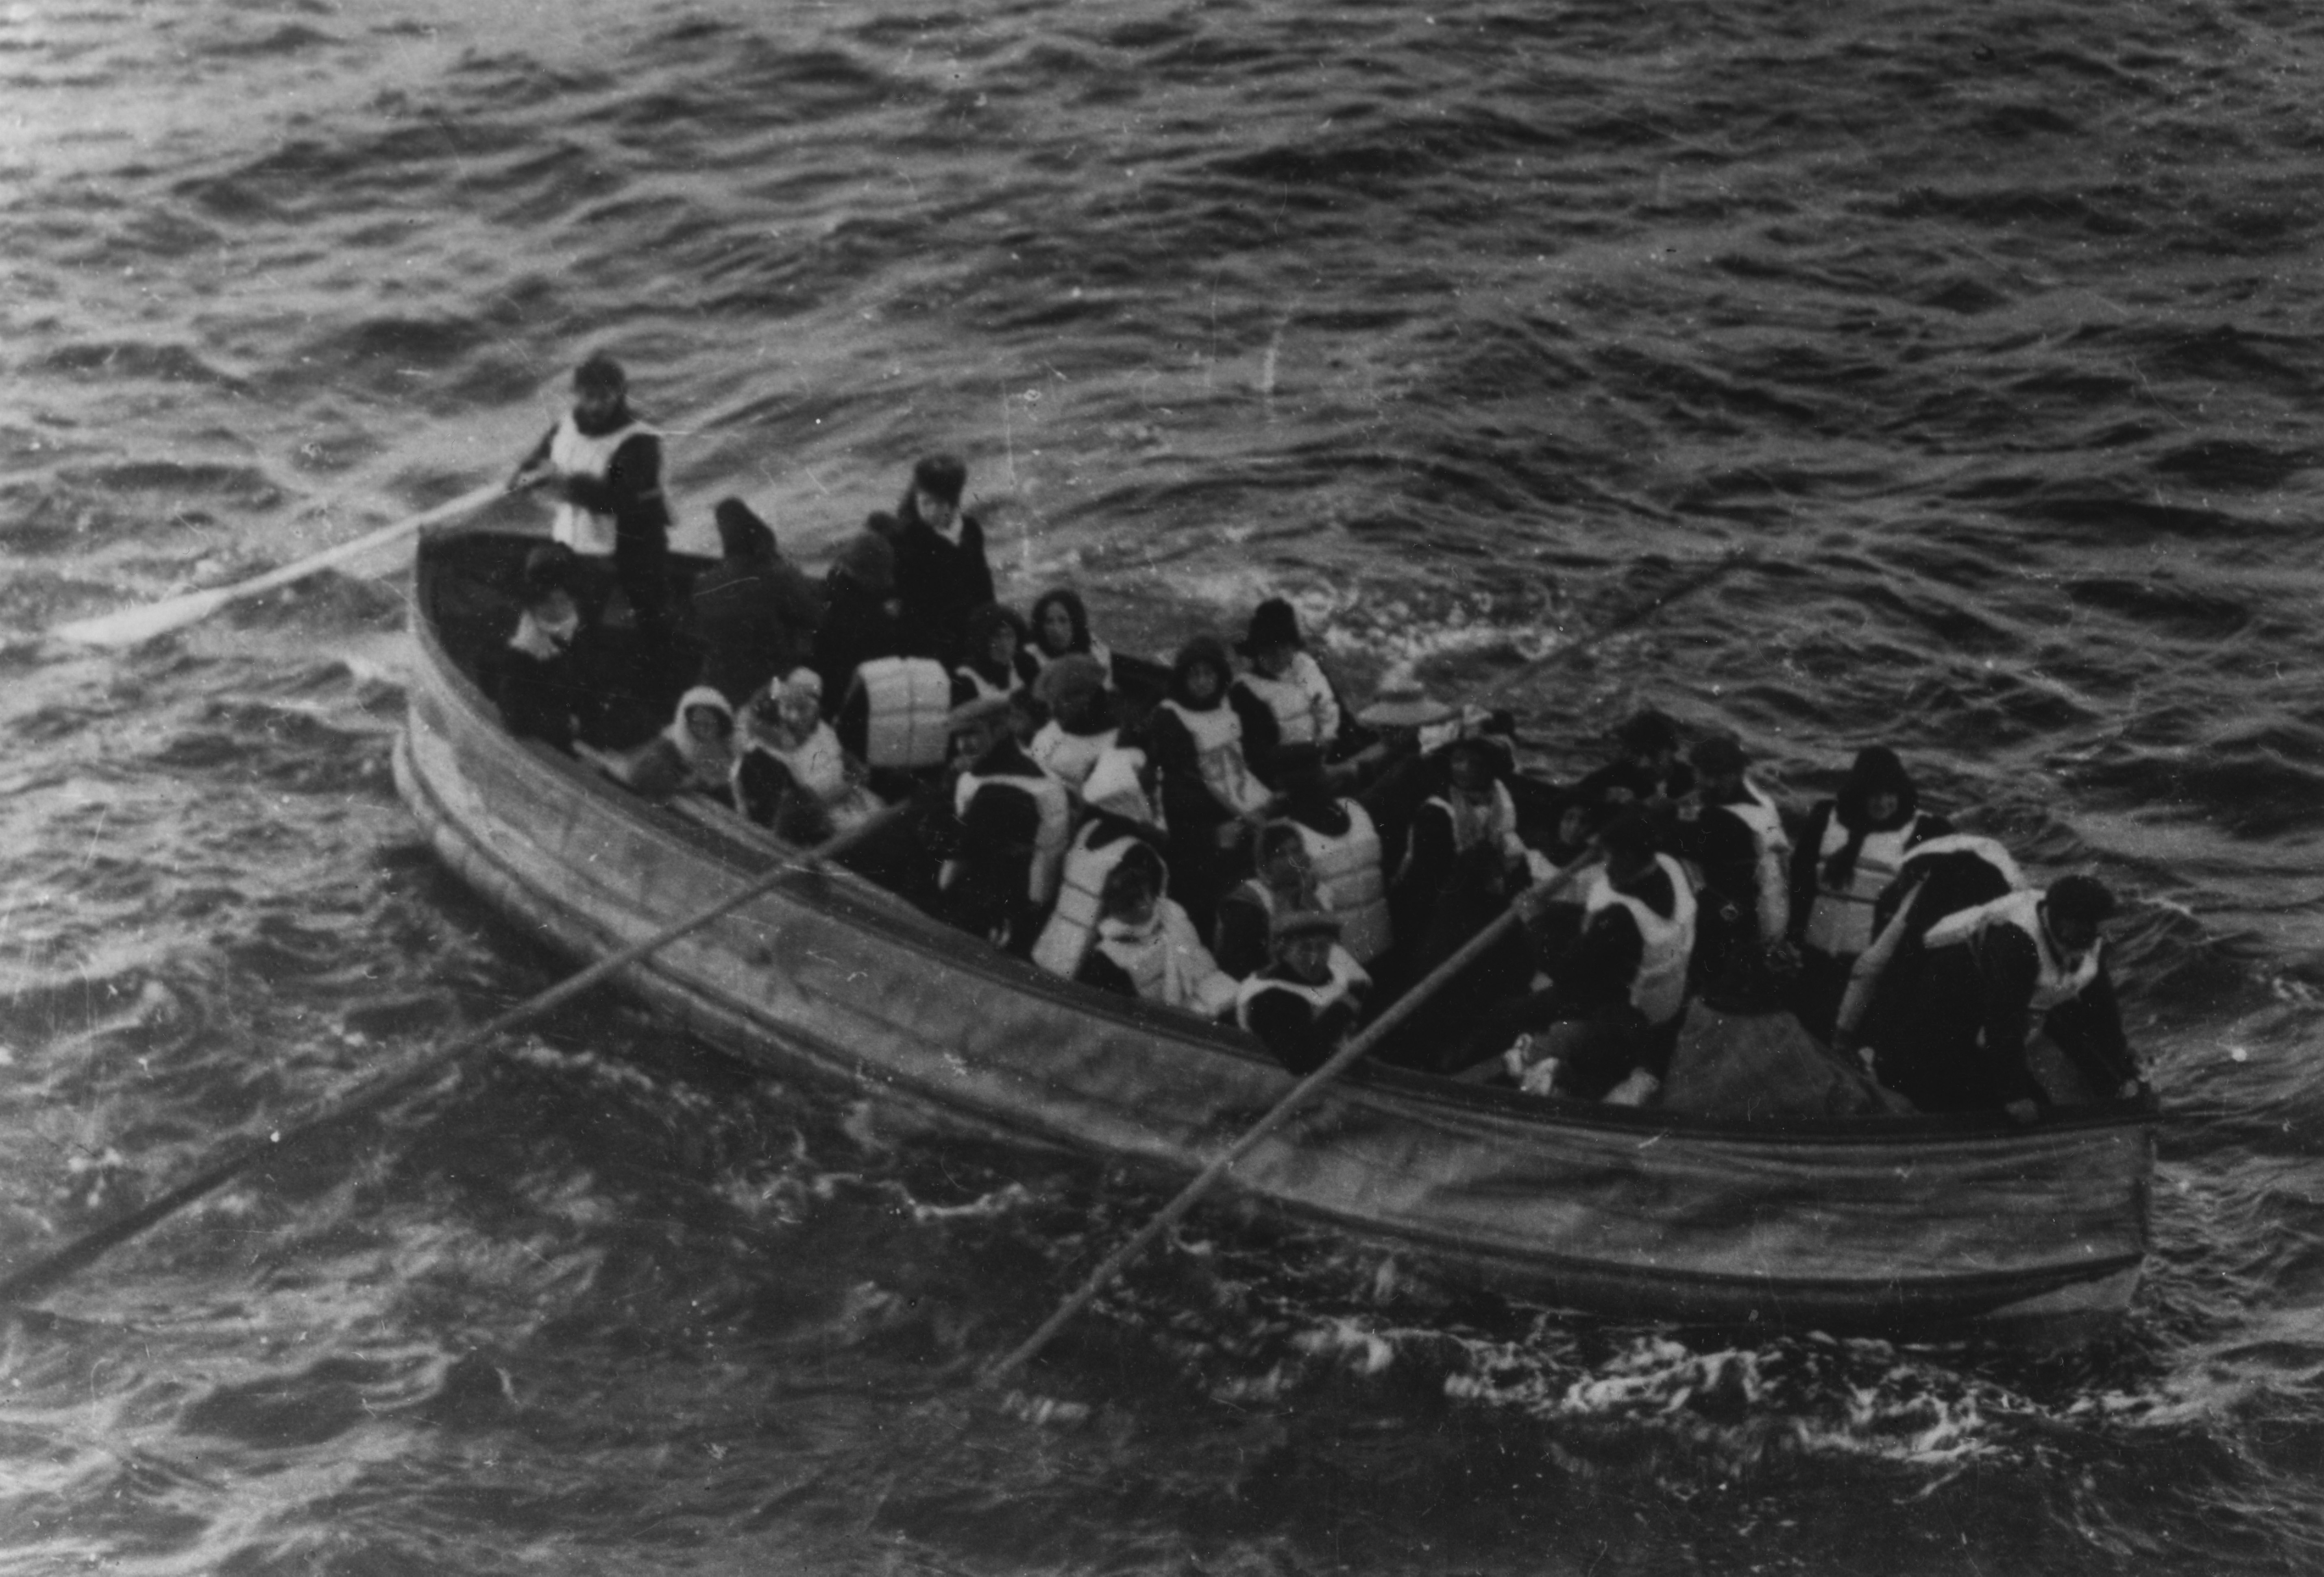
Titanic: Getting the Picture
Topics: decision trees, k-NN, and random forests. Storytelling and narrative. Data exploration: tables vs Venn diagrams vs visualization. Train and test sets. Confusion Matrix. Folds and cross validation. Pruning and avoiding overfitting.
Code: R, Python / Tool: RStudio, Jupyter
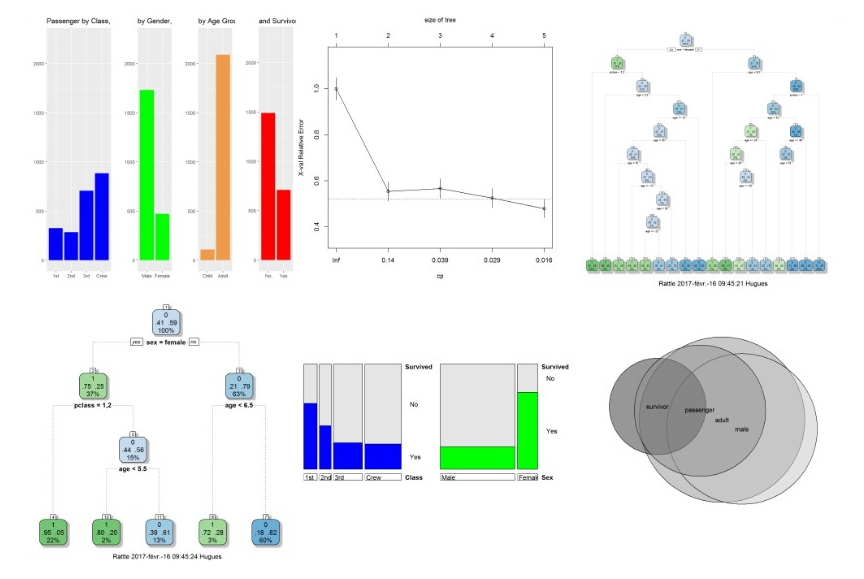
A fully-fledged report in RStudio
Consult the case in a new tab (Show/Hide All Code in the case upper-right corner).
An abridged report in Jupyter Notebook (Python)
- Using the
skikit-learnmodule. - Posting two results to Kaggle. Titanic: Machine Learning from Disaster is simple competition to start with on Kaggle.
Consult the case in a new tab.
A fuller report in Jupyter Notebook (Python)
- Revamping the abridged report.
- Posting four results to Kaggle under Titanic: Machine Learning from Disaster.
Consult the case in a new tab.
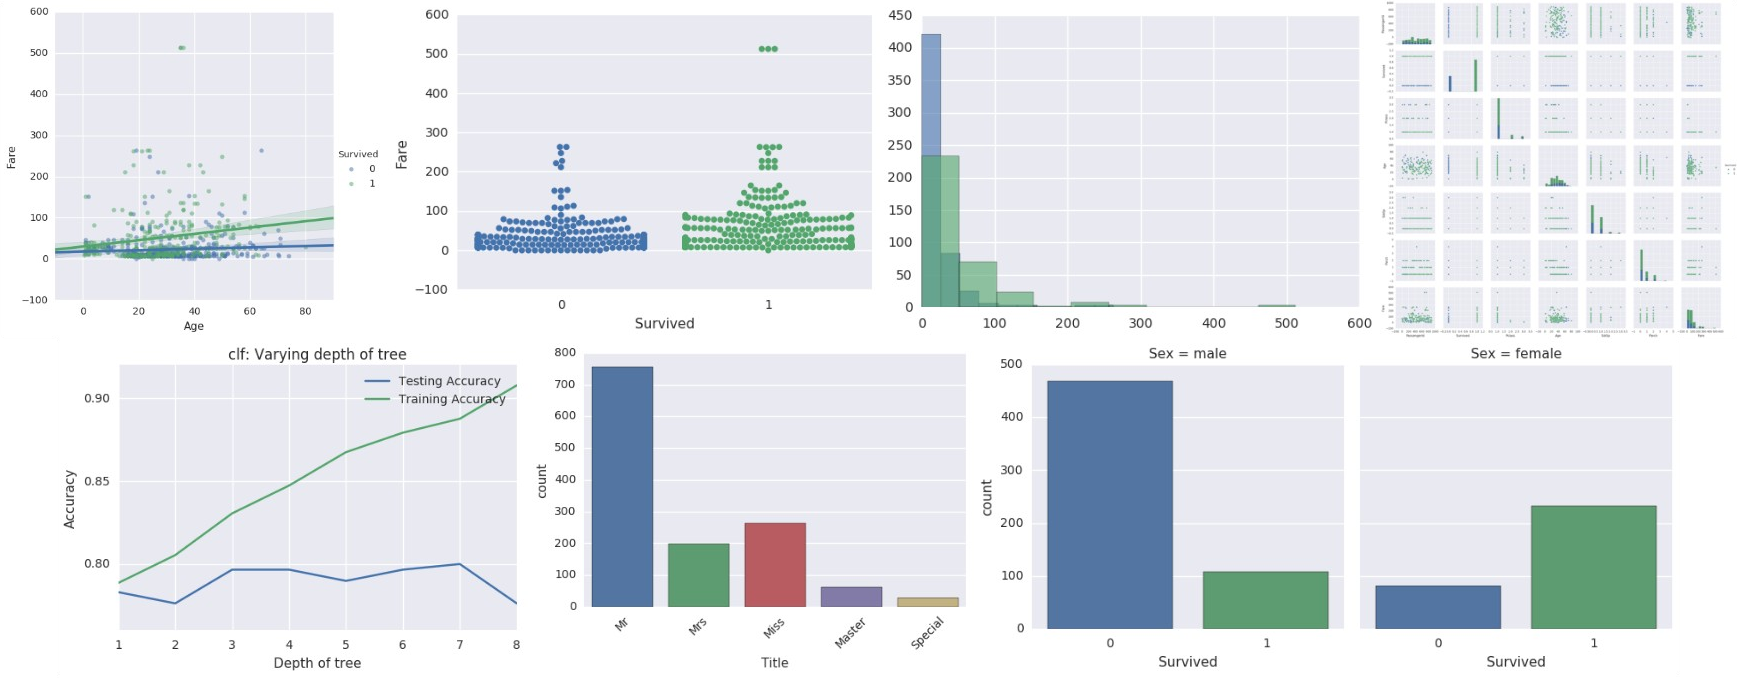
The fuller report has better exploratory data analysis (EDA) and visualization (comparable to the R fully-fledged report). The abridged report has basic EDA and no visualization. The abridged and fuller reports focus on decision trees and feature engineering. In addition, the abridged report includes randoms forests.
Find out more Titanic facts.